What is the BCG Growth Share Matrix?
The BCG Growth Share Matrix is a foundational corporate strategy framework that is used to assess where and when to invest in or phase out a company’s different business activities.
At Parametric Pro, we routinely use the BCG Growth Share Matrix to identify which business units are performing well and which units should be repositioned or divested.
Unlike some other frameworks, the BCG Growth Share Matrix can be applied to every industry since the matrix essentially reorganizes business units from a product lifecycle perspective into a framework for capital allocation. Whether you’re a sole proprietorship or a multinational corporation, this framework can help tailor your business’ trajectory.
Created in 1968 by Bruce Henderson, the founder of the Boston Consulting Group (BCG), the Growth Share Matrix helped roughly half of the United States’ Fortune 500 companies expand and dominate global markets in the 1990s.
How does this framework function?
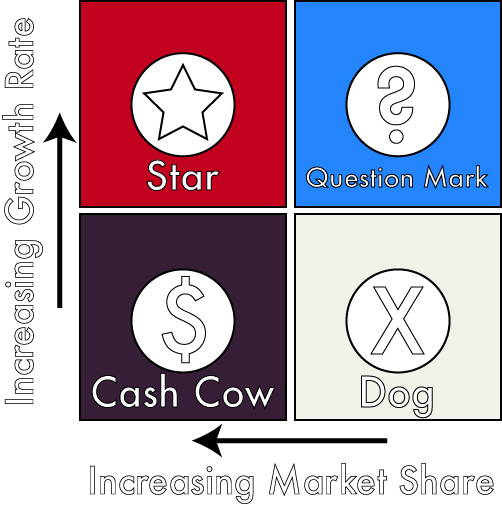
The matrix is organized into 4 quadrants via two factors: your product or service’s growth rate in the market as well as its market share relative to the top performer in your industry.
When this framework was created, the line that divided high and low growth product lines was 10% annual growth. Today, it is more ambiguous and depends on the industry (e.g., technology has a higher quota of >20% annual growth).
On the other axis, product market share is usually measured as a proportion of the highest performer in the industry (i.e., if the highest performer has a 50% market share and you have a 20% market share, then your relative market share is 40%). The line that divides small and large market share product lines usually lies between 30-40%.
So, where does your product or service fit on the matrix?
Question Marks & The Product Life Cycle
All new products and new ventures begin as question marks. They grow quickly but don’t have a significant position in the market. These product lines rely on marketing to grow their market share.
It is important to note that not all question marks end up as stars. In fact, most question marks end up skipping the entire product life cycle and die as dogs. This isn’t a bad thing though, it can help you save money and time by cutting off underperforming offerings.
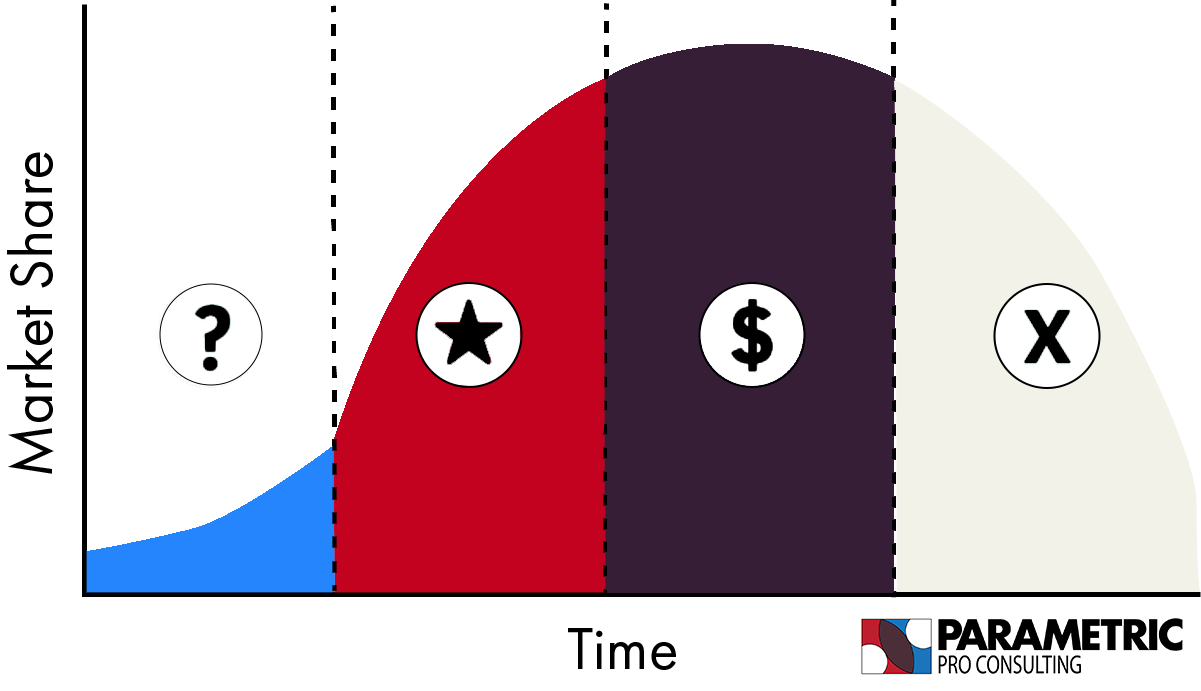
The Growth Share Matrix was built with the product life cycle in mind.
Question Mark products are in the “introduction” stage of the product life cycle. They face the notorious challenge of overcoming the “chasm of death” where many product lines and companies die, which you can avoid by ensuring that you work on getting mainstream adoption and sales growth.
Large enterprises, such as Samsung and Amazon, invest heavily in Question Marks because every Star starts as a Question Mark. Samsung’s current Question Marks include their VR technology and satellite technology.
In 2014, Amazon launched the Fire Phone as an attempt to compete against Apple and Samsung’s duopoly. At its launch, the phone had zero market share but high hopes of penetrating the market. Unfortunately for Amazon, the phone never received mainstream adoption and skipped straight to dog status.
Stars
If a new product or business venture achieves mainstream adoption and has sustained high annual growth rates, it is labelled a star. A current example of a star product line would be Tesla’s Model 3.
The product line has a dominant presence in the market and is experiencing high annual growth. Star products have successfully escaped the “chasm of death”.
From this point, star products rely on effective marketing and innovation to maintain their status. Star products are early in their product life cycle and have limited moats. If you create a star, congratulations! Don’t sit back just yet though.
Stars are relatively easy to copy and often experience replications by other companies trying to tap into both the high growth rates you are experiencing as well as your confirmed value proposition. This is where you need to cement your place in the market or risk losing market share to copycats.
Later into a product’s life cycle, stars will begin to turn into either dogs or cash cows. Your star may scale into cash cow status, or get acquired by a company with high market share and get spun into a cash cow.
Cash Cows
Cash cows have a large market share but do not show much opportunity for further growth. Because of this, you can usually just leave them to run and produce profits.
Instead of reinvesting profits, you should consider reallocating profits from cash cows into stars and question marks, since they are the products that will become the next generation of cash cows.
Many large companies, such as Google, have departments called skunkworks, which have small teams whose sole mission is to create question marks. Current examples of cash cows in the market would include Frito-Lay chips, Adobe apps, and HP’s printer product line. Cash cows generate excellent profits and do not require much effort to sustain or run.
You may not have the resources to build a skunkworks department, but that doesn’t mean you can’t become your own skunkworks! Try letting your cash cow do its thing, and work on developing your next question mark.
Dogs
Finally, every product eventually ends up as a dog. Dogs have declining market shares, low growth rates, and poor profits. Dogs do not add value to brands, so they should either be repositioned or divested.
An example of a dog company would be a CD manufacturer. The market has negative growth and is losing market share for data/media storage. Several CD manufacturers exited the market in the last decade via acquisition, and were subsequently repositioned towards media solutions for elders, since this demographic tends to be “sticker” with technology.
If your product is in the dog stage, you should consider what would change if you let it keep running versus shutting it down entirely or scaling it back. This can greatly improve your resource allocation and save you time and money.
Conclusion
The BCG Growth Matrix can be a critical tool for your business to identify where each of your product lines stand and what needs to be done with them to generate the greatest profits. By using this matrix and going through the exercise of identifying where each of your product lines stand, you will be able to generate an effective corporate strategy.
More specifically, the matrix will show you which product lines require the most marketing and R&D spending. By understanding where your product lines stand in the industry landscape, you’ll be able to tailor your strategy for its individual needs.
If you liked this post, please consider sharing it with your network!
Check out our Business Strategy Frameworks guide for more useful tools.
Want to learn more and see how we can help your business? Book a free consultation call.
Are you interested in the consulting industry? Parametric Pro Consulting Foundations offers more in-depth knowledge on this article as well as several other topics to prepare you for a career in business and consulting. Check it out here!